Open the estimating settings
Open Admin › Settings › Estimating. The page Plot package quantities says the figures are advisory: nothing changes on a quotation until someone applies them.
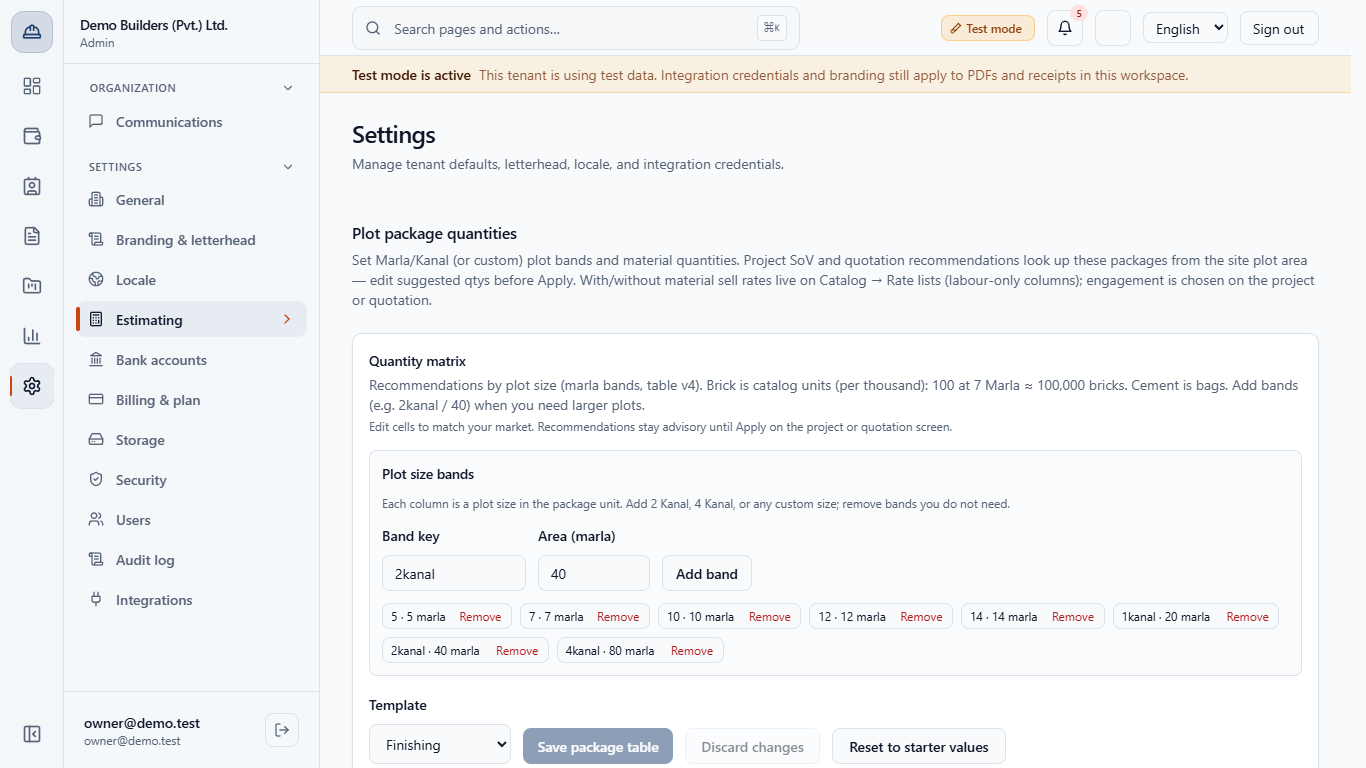
Your estimators get a first set of quantities from the site's plot area. This guide shows where those quantities come from, how to add a plot size, change a figure for your market and see it used on a quotation.
Open Admin › Settings › Estimating. The page Plot package quantities says the figures are advisory: nothing changes on a quotation until someone applies them.
Each column is a plot size in marla: 5, 7, 10, 12, 14, 1kanal (20 marla), 2kanal (40) and 4kanal (80). To add one, type a Band key and an Area (marla), then click Add band. Empty fields, a missing area and a repeated key each get their own message.
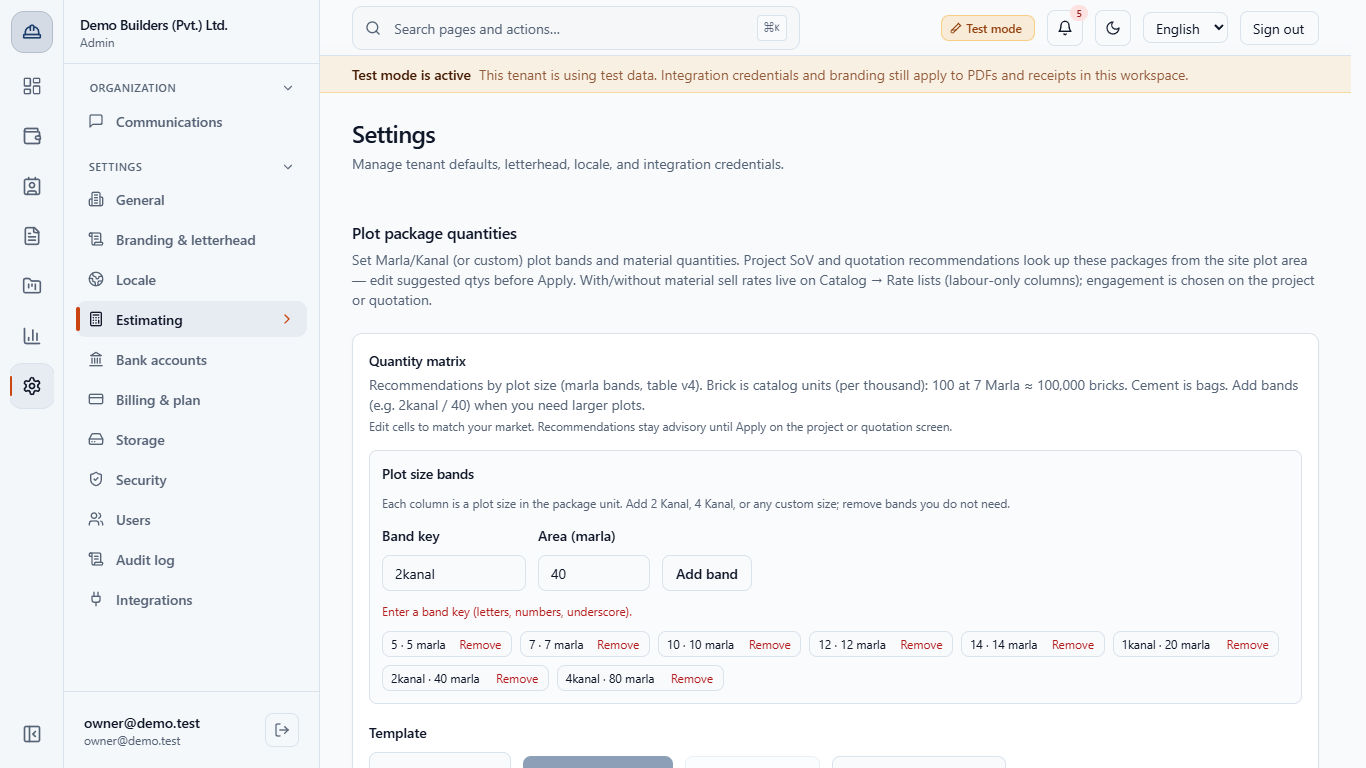
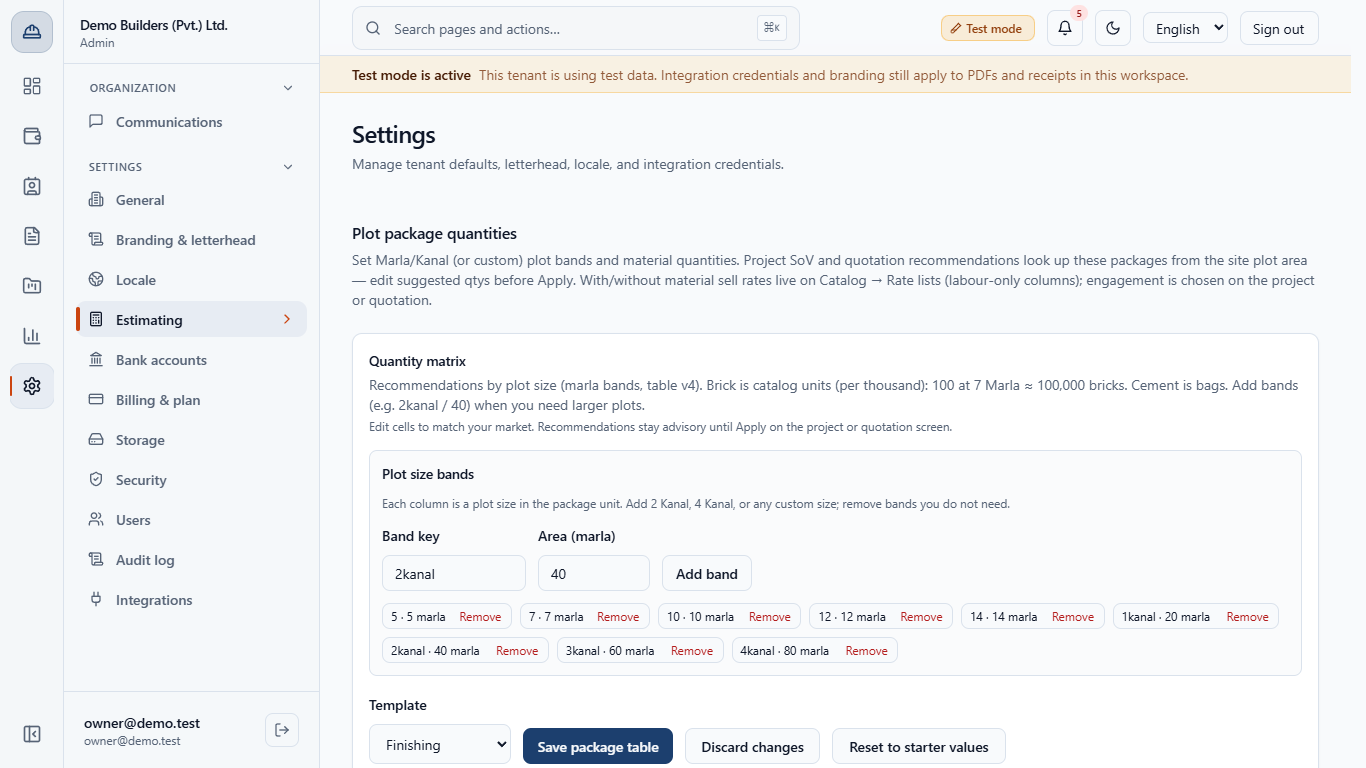
Type 3 Kanal and 60. The key becomes 3kanal, the band sits between 2kanal and 4kanal and every row is filled in by interpolation. Save package table and Discard changes become active.
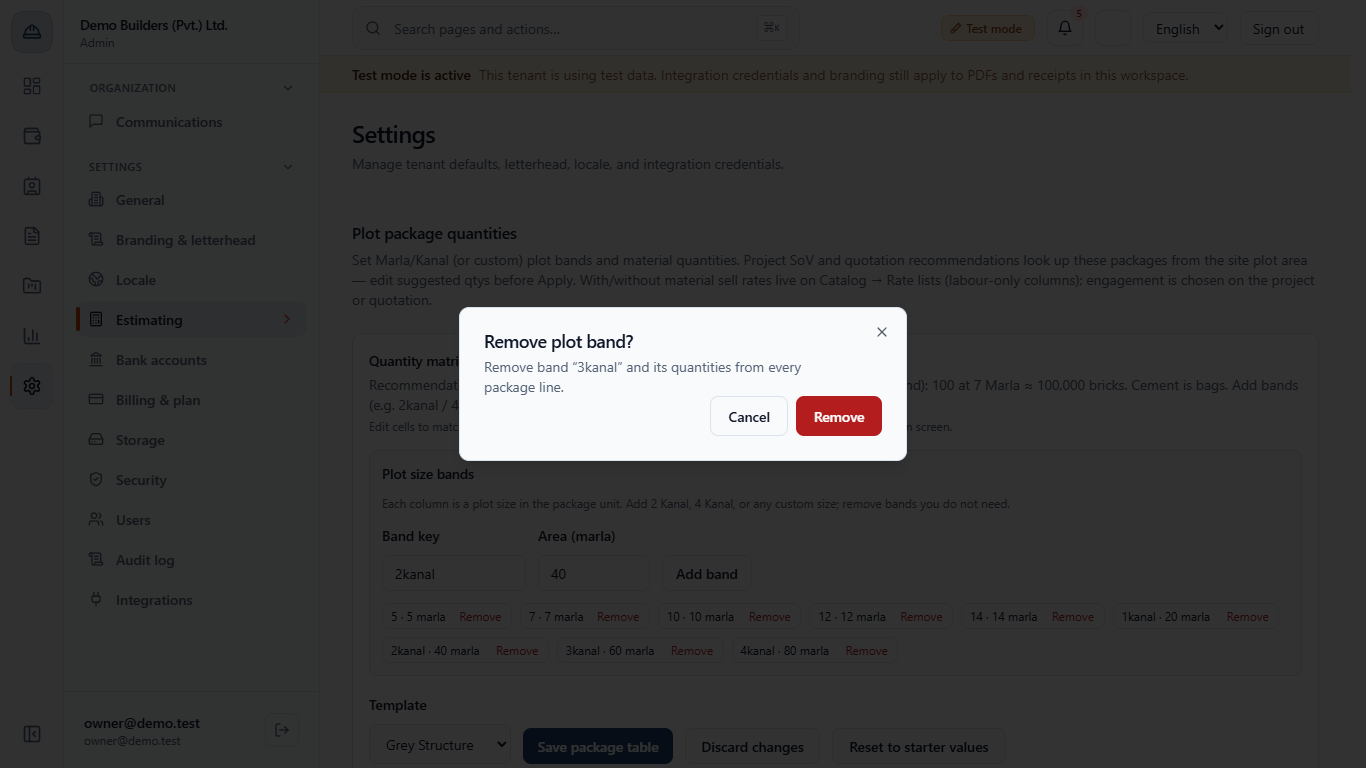
Remove asks Remove plot band? The band disappears from every template and every line. Cancel keeps it.
Template lists Finishing, Grey Structure and Turnkey. Each has its own rows, and every row names the line, its section, the item code and the unit. A row with Unit: marla (built area) holds the built area in marla, 80% of the plot by default, so a 10 marla plot gives 8.
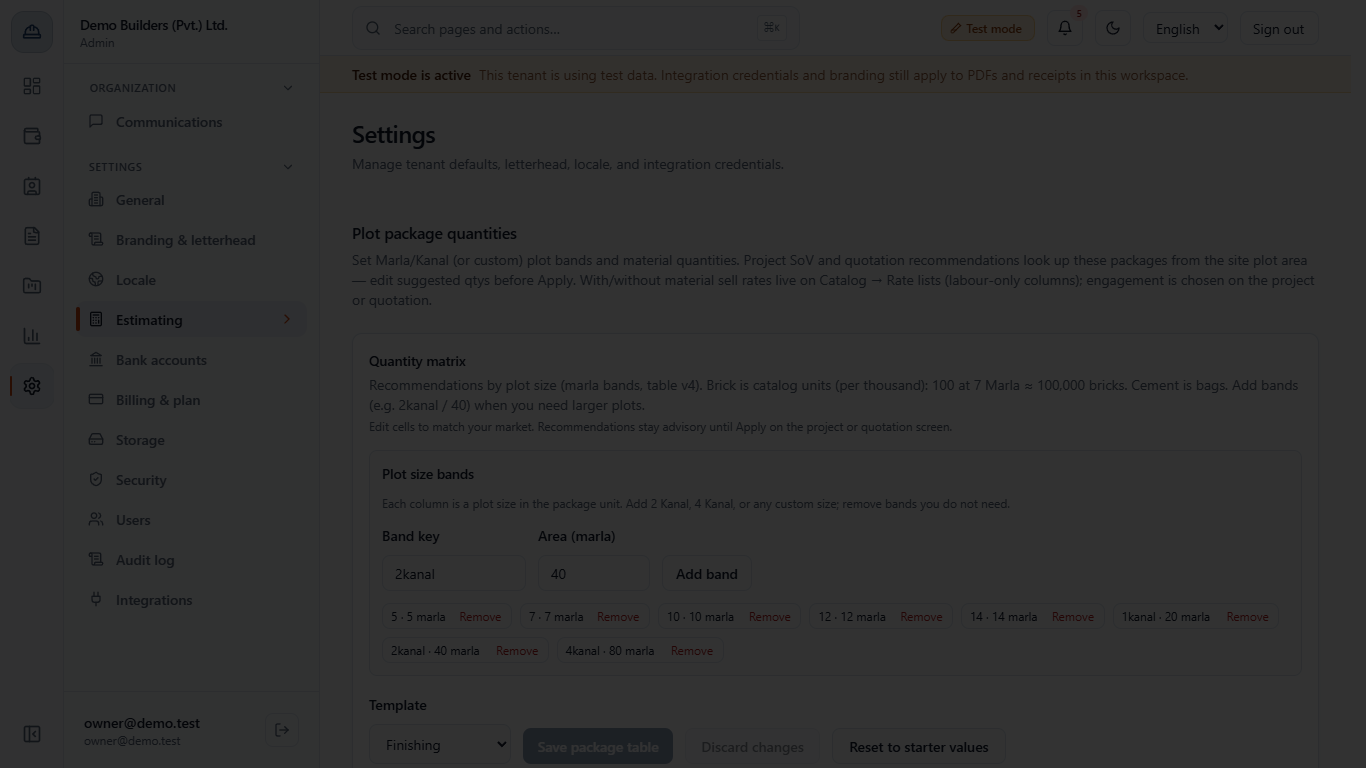
In Grey Structure, Rebar 10 mm (Unit: Kilogram) is 2,200 kg at 7 marla and 3,143 kg at 10 marla. Portland cement (50 kg bags) is counted in bags and A-grade brick (per thousand) in thousands.
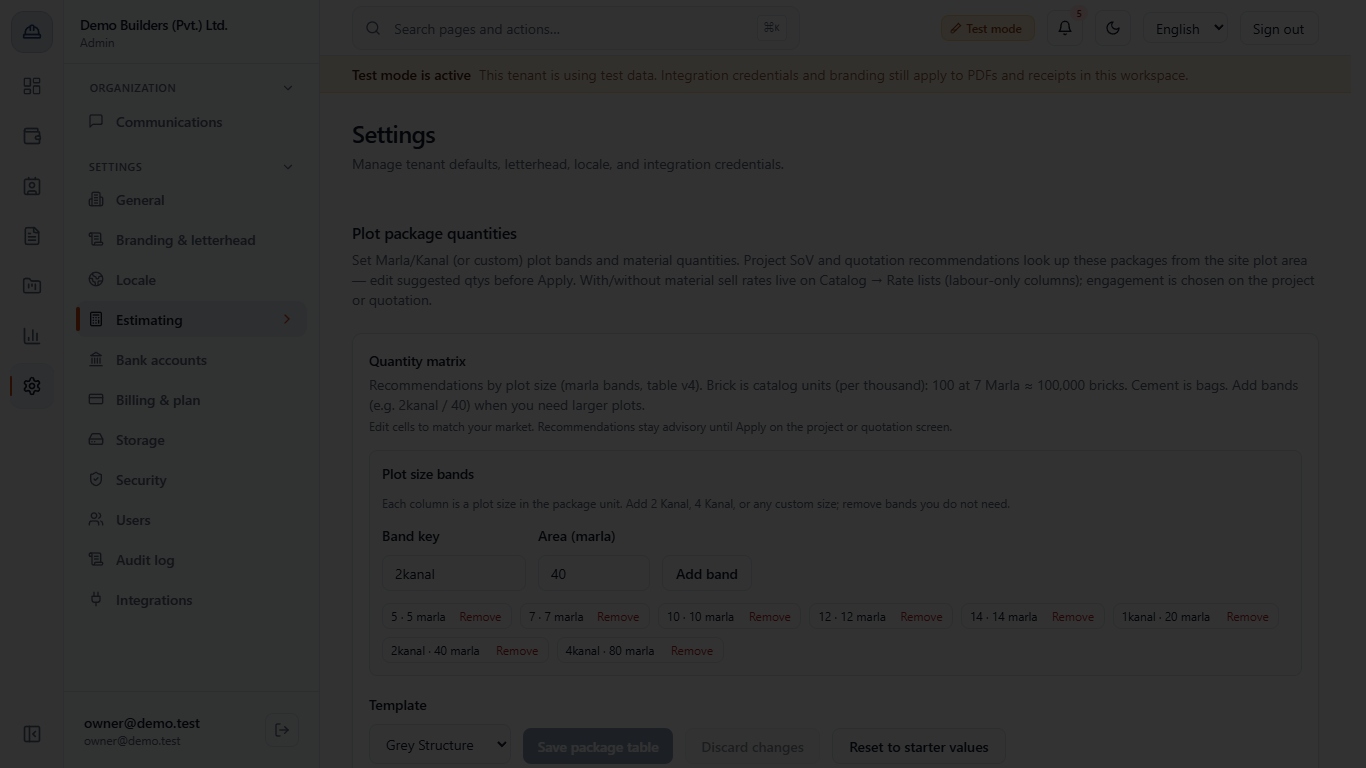
Click the 10 marla cell of Rebar 10 mm and type 3300. Save package table and Discard changes light up. Clearing a cell removes that band's value.
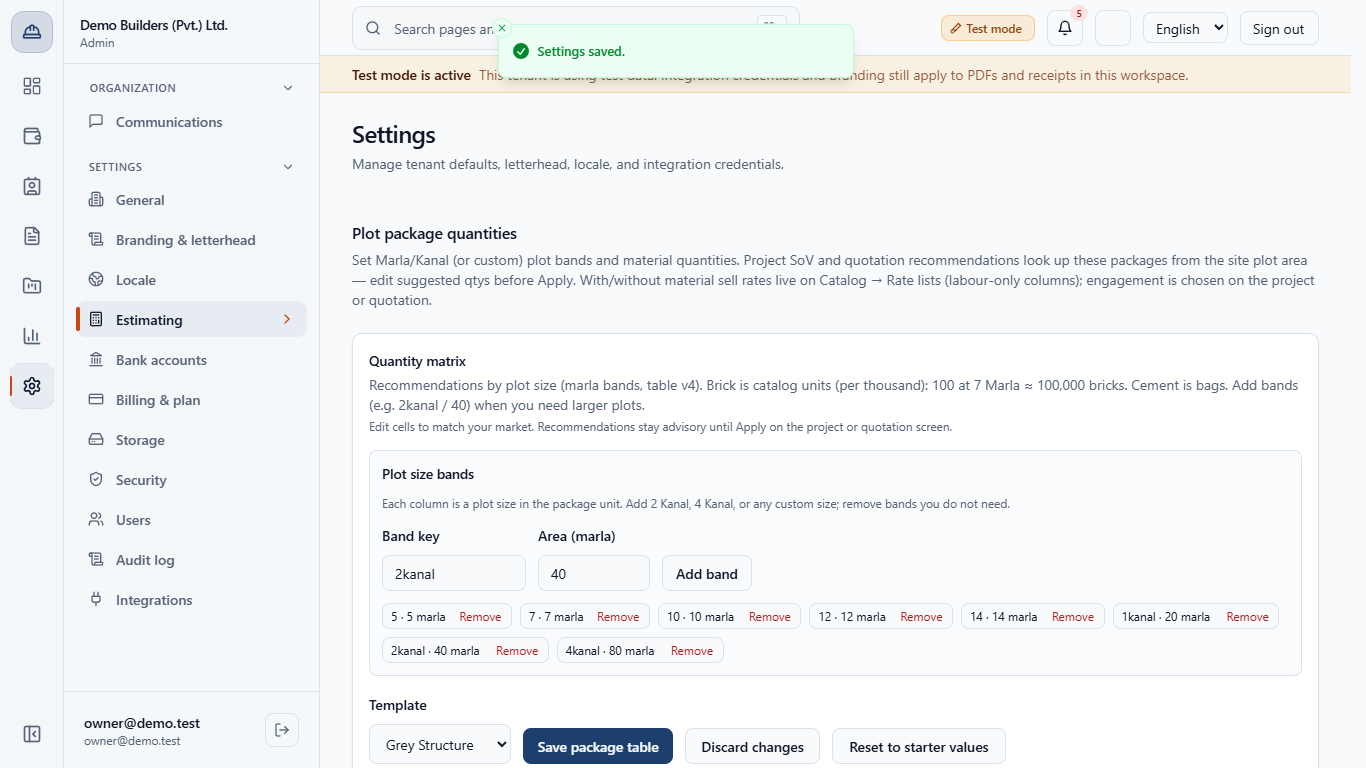
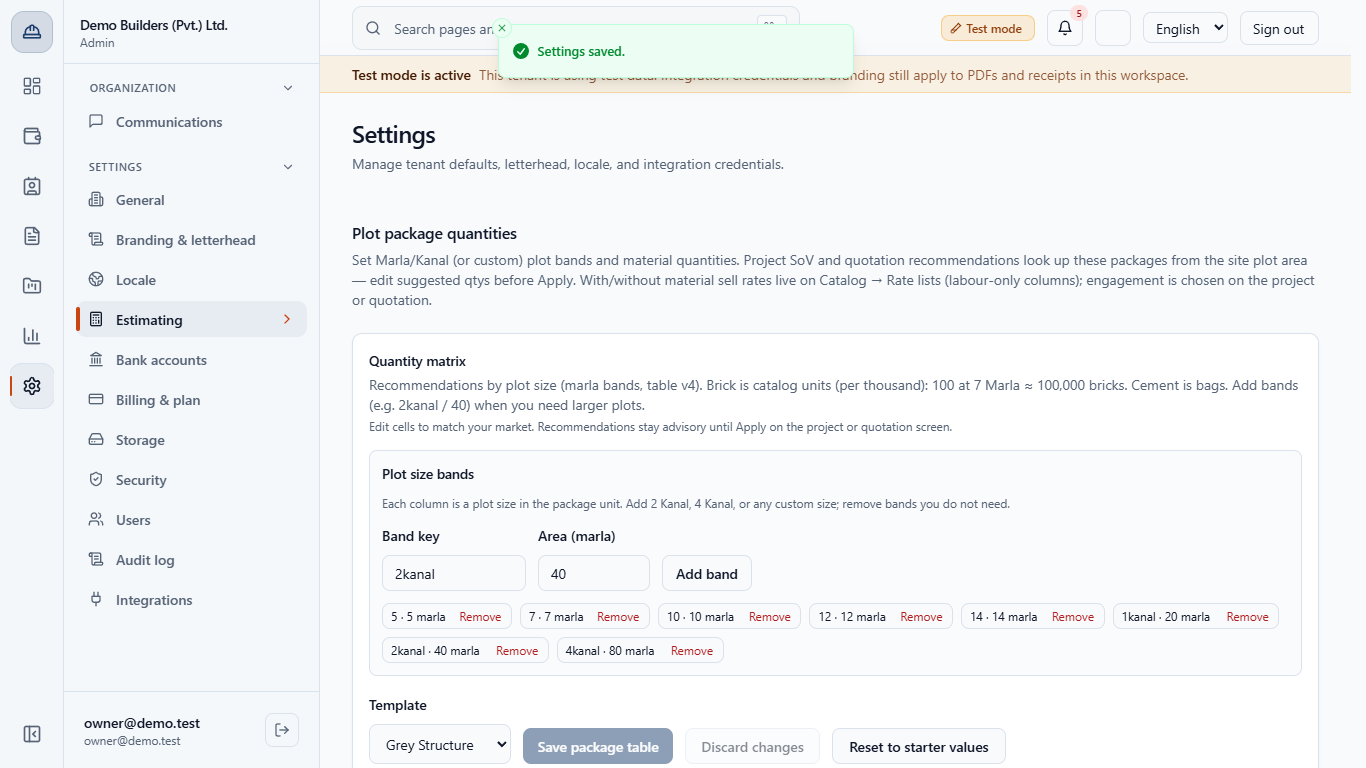
Click Save package table. The app says Settings saved. and the two buttons grey out again.
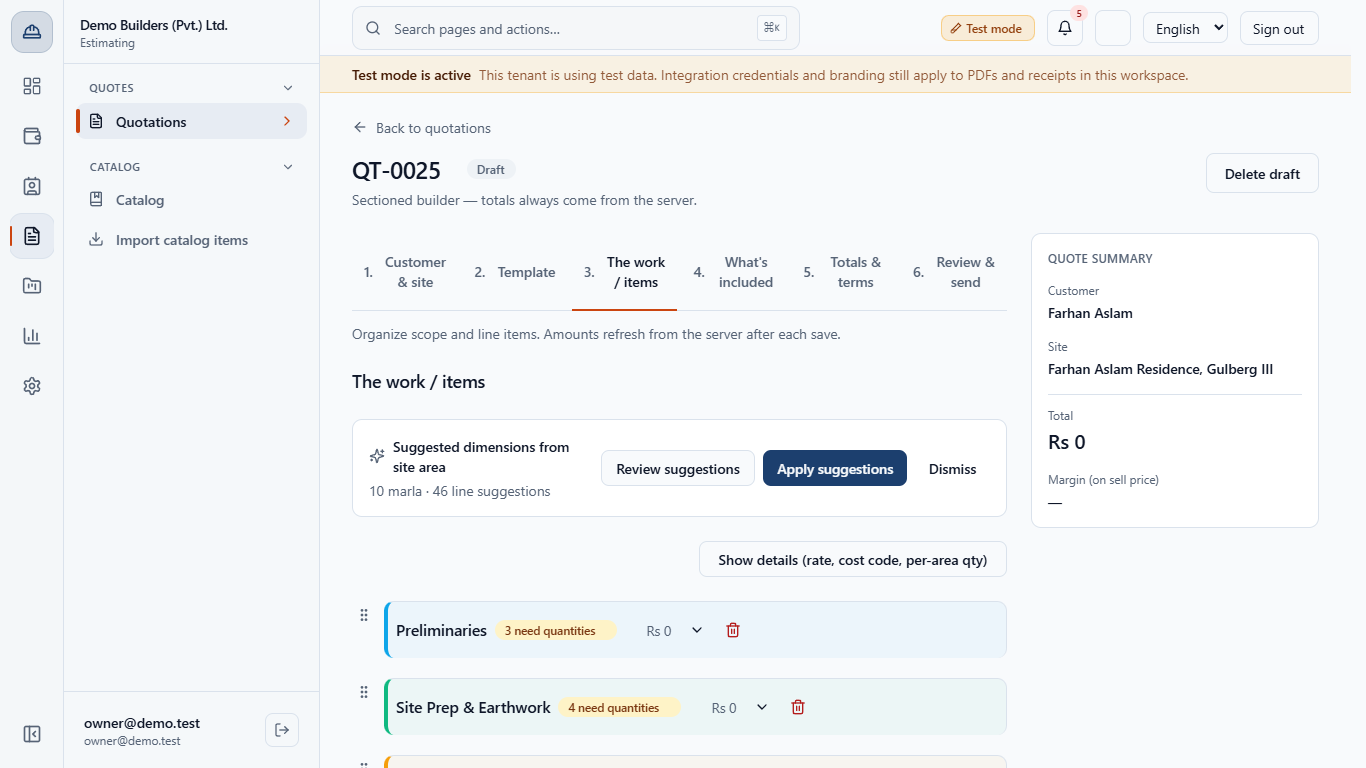
Open a quotation, step The work / items. The panel Suggested dimensions from site area shows the plot (10 marla) and the number of suggestions (46 line suggestions).
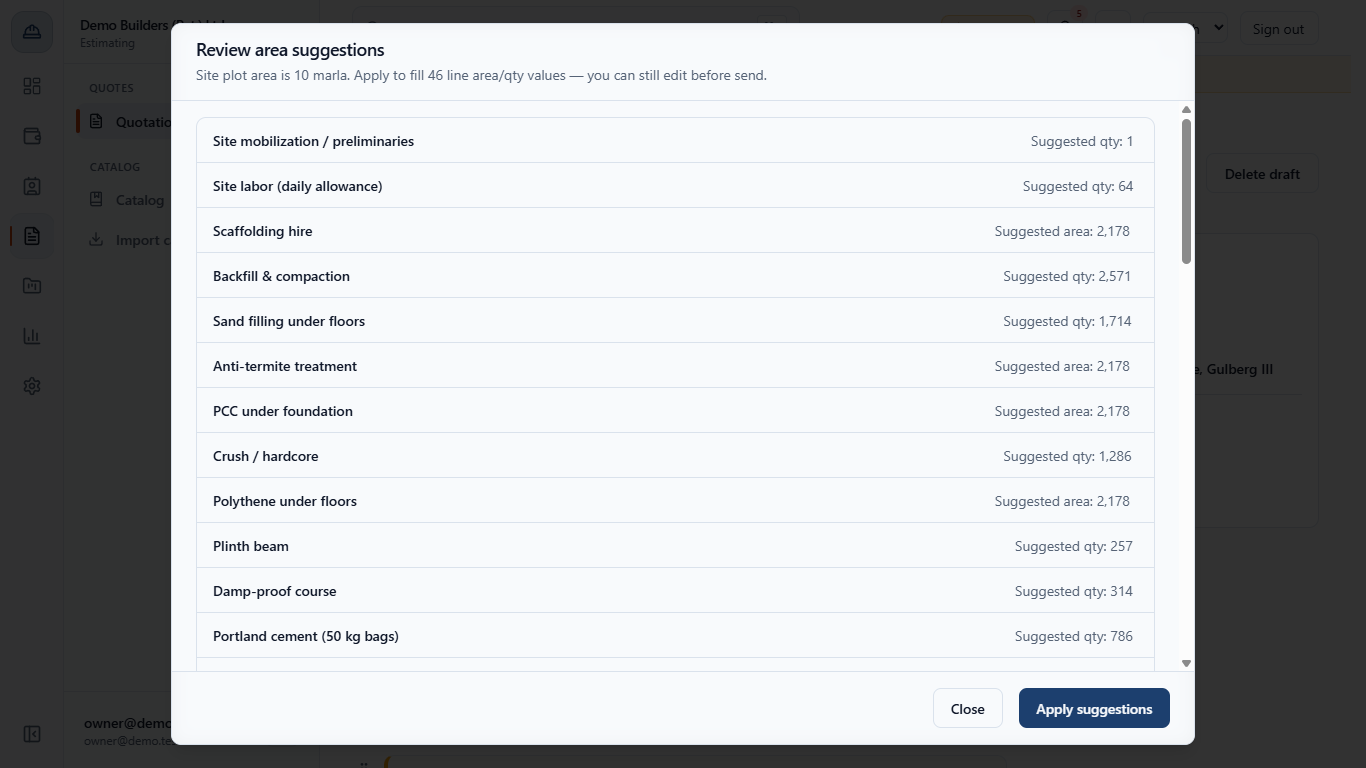
Click Review suggestions. Rebar 10 mm now reads 3,300, the figure you saved. Nothing is written until you click Apply suggestions.
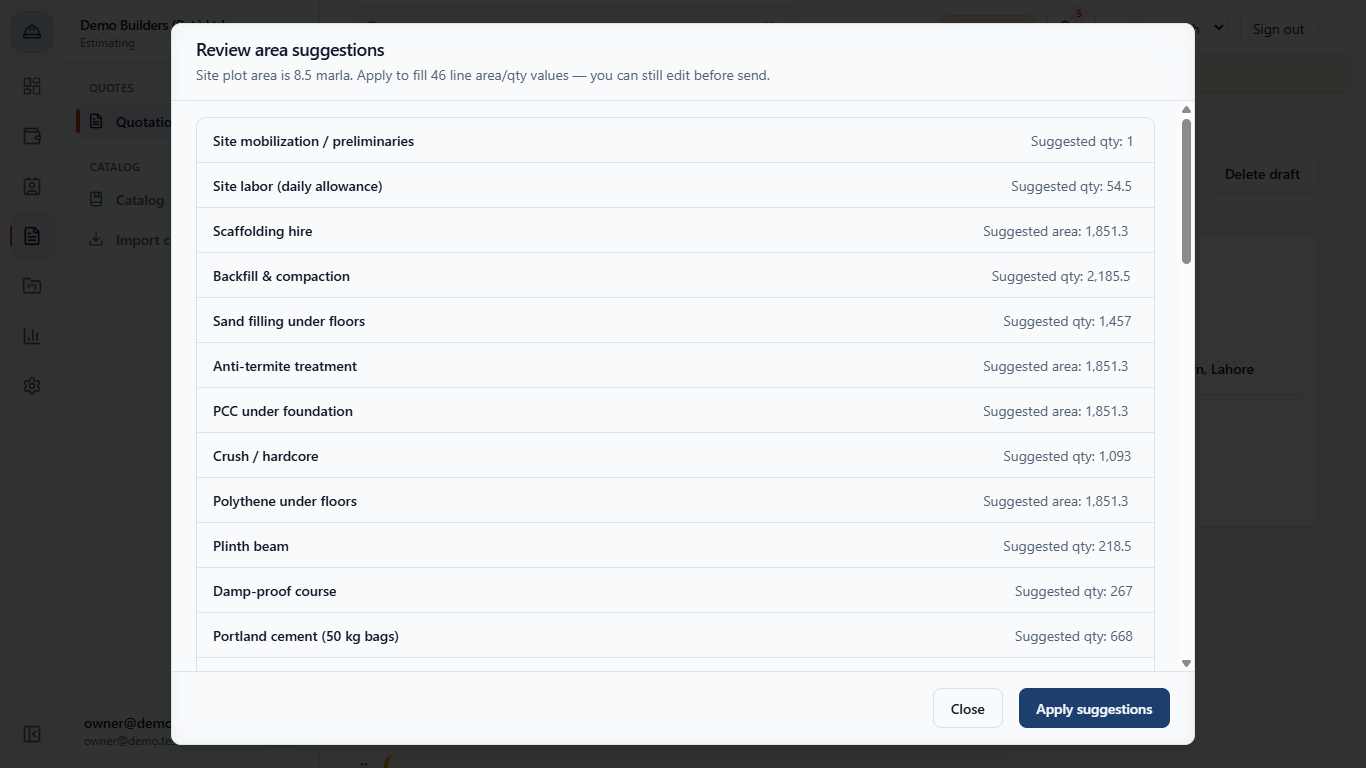
For an 8.5 marla plot the app draws a straight line between the 7 and 10 marla columns: Rebar 10 mm 2,750 kg.
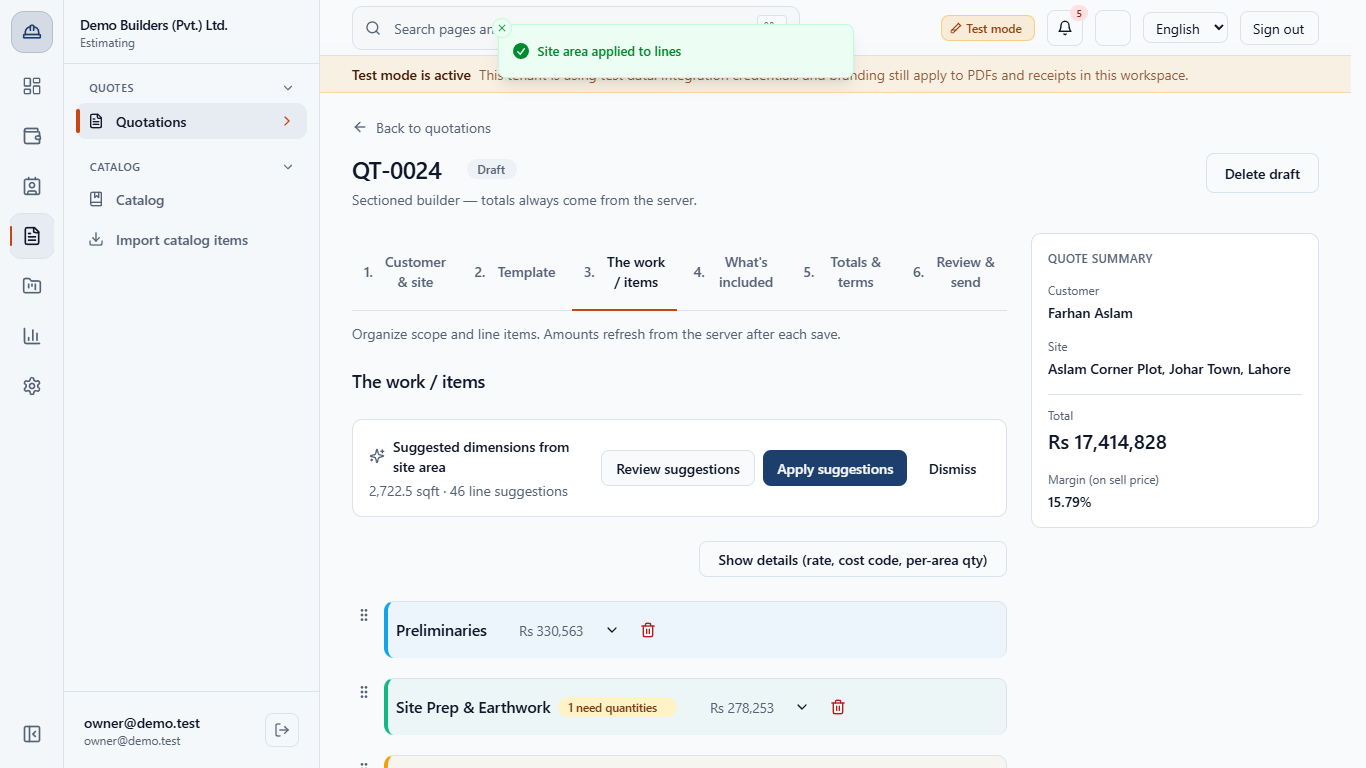
After Apply suggestions the app says Site area applied to lines and the totals move. Lines priced per square foot, such as scaffolding or the roof slab, receive the area in square feet (2,178 for a 10 marla plot). Edit any value before you send the quote. A line with no suggestion, such as Excavation, shows Quantity required and "Counts as zero until a quantity or area is entered": type its quantity yourself.
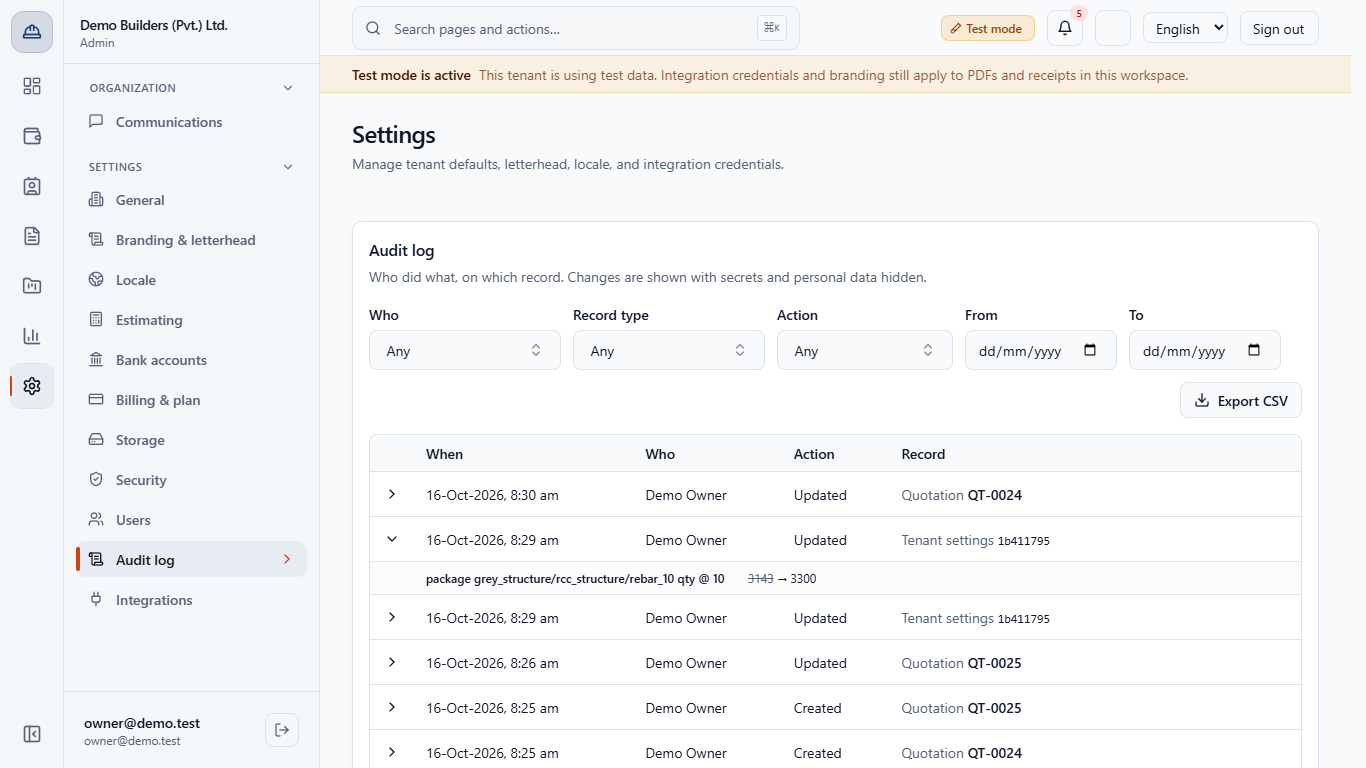
Open Admin › Settings › Audit log. The row Updated – Tenant settings opens to show exactly what changed: package grey_structure/rcc_structure/rebar_10 qty @ 10, 3143 → 3300, with who saved it and when.
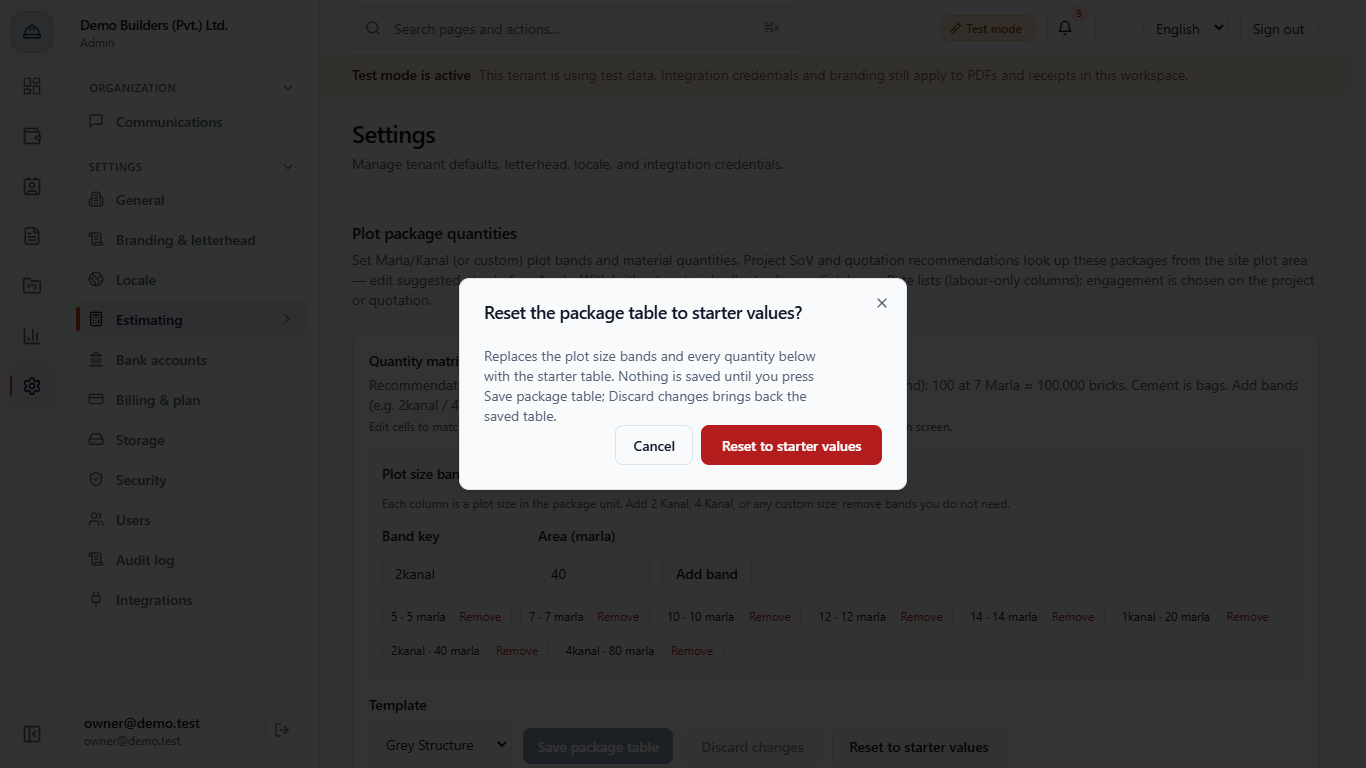
Discard changes brings back the table as it was last saved. Reset to starter values asks for confirmation and then fills the table with the original figures, for example rebar at 10 marla back to 3,143. Neither is saved until you click Save package table.
| Mistake | What you see | Fix |
|---|---|---|
| Added a band but did not save | The band is missing after you leave the page | Click Save package table |
| Added a key that exists | That band key already exists. | Use a new key |
| Expected the estimator to change the table | The Estimating page is not open to them | Ask the Owner |
| Pressed Reset to starter values and left the page | The saved table is unchanged | Reset is a draft: it needs Save package table |
| Item | Meaning / rule |
|---|---|
| Band | A plot size in marla; 1 kanal is 20 marla |
| Quantity row | Catalog unit, for example kg or bags |
| Area row | Built area in marla, 80% of the plot |
| Between bands | Straight-line figure |
Does changing the table change quotations I already made? No. The figures are used only when you click Apply suggestions on a quotation.
What happens with a plot between two sizes? The app draws a straight line between the two nearest columns.
Can I go back to the original figures? Yes. Reset to starter values fills the table with the starter figures; click Save package table to keep them, or Discard changes to go back to the saved table.
Where do I see who changed a figure? In Admin › Settings › Audit log: the row for the settings update names the line, the plot size and the old and new quantity.
Who can change the table? The Owner. The seeded Estimator, Project manager, Accountant and Site supervisor roles have no settings permissions.
BuildFlow runs this whole workflow. See what BuildFlow does and what it costs, or browse all step-by-step guides.